In this post, we are going to explore the steps needed to easily monitor an angular application for performance and usage, using Azure Application Insights.
Azure Application Insights
Azure Application Insights is an extensible Application Performance Management (APM) service for web developers that allows you to detect and diagnose issues and gives you insights on how your web apps are used by your clients.
It is only a few clicks away when setting it up for .net, node.js, java or mobile apps, but when it comes to Single Page Apps (SPA), such as an Angular application, things may get a bit trickier.
Application Insights & Angular
Prerequisites
To monitor your Angular application using Azure Application Insights, you will need the following:
- an Azure account
- an application insights service setup
- MarkPieszak/angular-application-insights package
- angular-cli to bootstrap a new application
- npm or yarn package manager to install the necessary packages
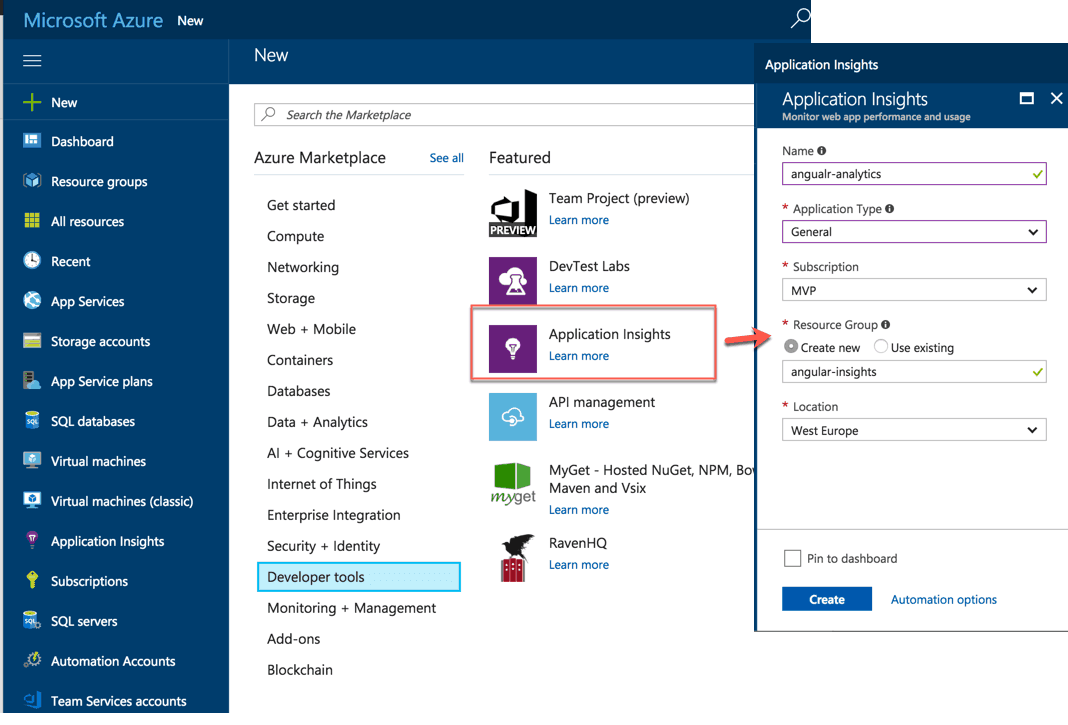
Step 1. Create an Azure Application Insights service
From Azure Portal click on the New menu button, then from Azure Marketplace categories select Developer Tools and click on Application Insights. Then give a name, select General in Application Type, choose the location where your App Insights service will be created (preferably a location closer to where your app will be, to avoid network latency).
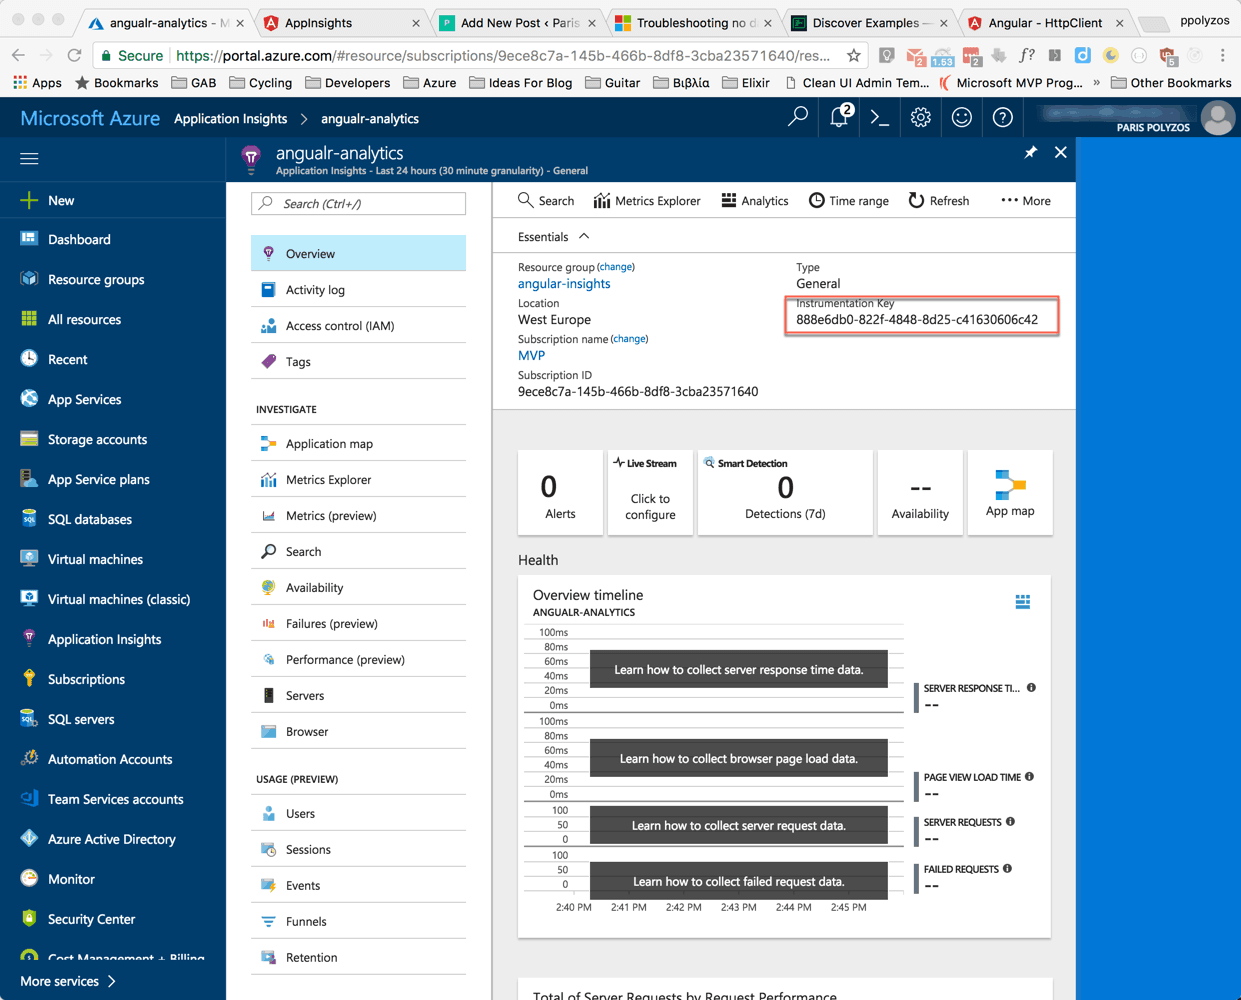
After a few seconds, the Application Insights service will be created and, from the Overview dashboard, you will need to select the Instrumentation Key. This is the key that will be used by your Angular application to send metrics to your Application Insights service.
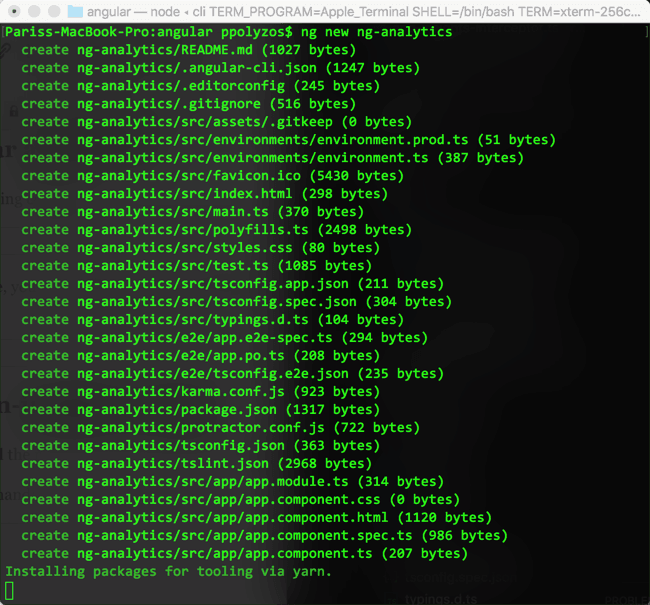
Step 2. Start with a new Angular application
Let’s create a new Angular application, with the following command:
ng new ng-anaytlics
If you don’t have angular-cli installed in your machine, you can simply execute the following command:
npm install -g @angular/cli
Step 3. Add angular-application-insights package
The README file provided in the package tells you all the necessary steps needed to setup this up.
So, what you have to do is execute the following command:
$ npm i -S @markpieszak/ng-application-insights

// or if you use yarn
$ yarn add @markpieszak/ng-application-insights
Then, in app.module.ts, perform the following changes:

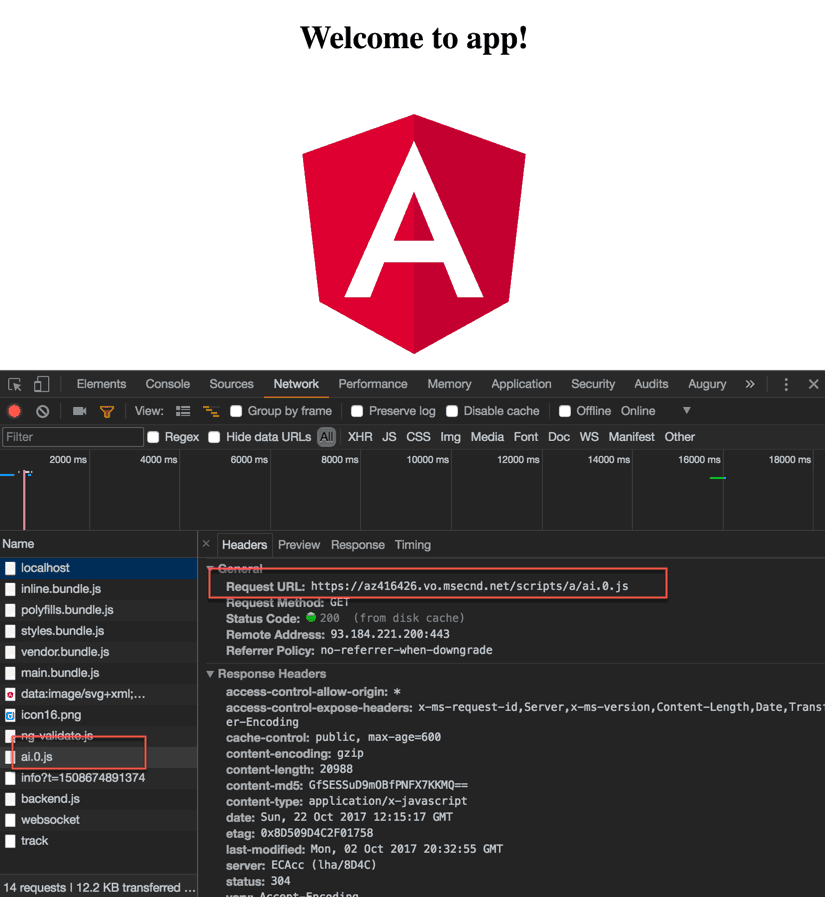
Now, when you reload your Angular application you will see, in Network tab, that the ai.0.js script is included and data has started to be sent to Azure App Insights.
NOTE: In case you come across the following error:
main.ts:12 Error: No provider for Router!
    at injectionError (core.es5.js:1169)
    at noProviderError (core.es5.js:1207)
    at ReflectiveInjector_.webpackJsonp.../../../core/@angular/core.es5.js.ReflectiveInjector_._throwOrNull (core.es5.js:2649)
    at ReflectiveInjector_.webpackJsonp.../../../core/@angular/core.es5.js.ReflectiveInjector_._getByKeyDefault (core.es5.js:2688)
    at ReflectiveInjector_.webpackJsonp.../../../core/@angular/core.es5.js.ReflectiveInjector_._getByKey (core.es5.js:2620)
    at ReflectiveInjector_.webpackJsonp.../../../core/@angular/core.es5.js.ReflectiveInjector_.get (core.es5.js:2489)
    at resolveNgModuleDep (core.es5.js:9492)
    at _createClass (core.es5.js:9531)
    at _createProviderInstance$1 (core.es5.js:9503)
    at initNgModule (core.es5.js:9456)
Remember to add the RouterModule in AppModule:
imports: [...
RouterModule.forRoot([
  { path: '', pathMatch: 'full', redirectTo: 'app' }
]),
...
]
Step 4. Send data to Azure App Insights
Now whenever you want to send data to App Insights you can use the App Insights Service and choose one of the supported methods:
AppInsightsService.trackEvent()
AppInsightsService.startTrackEvent()
AppInsightsService.stopTrackEvent()
AppInsightsService.trackPageView()
AppInsightsService.startTrackPage()
AppInsightsService.stopTrackPage()
AppInsightsService.trackMetric()
AppInsightsService.trackException()
AppInsightsService.trackTrace()
AppInsightsService.trackDependency()
AppInsightsService.flush()
AppInsightsService.setAuthenticatedUserContext()
AppInsightsService.clearAuthenticatedUserContext()
For more information on the supported APIs you can take a look at this.
Step 5. Use of Interceptors
A major feature of @angular/common/http is interception, the ability to declare interceptors which sit in between your application and the backend. When your application makes a request, interceptors transform it before sending it to the server, and then they transform the response on its way back before your application sees it.
So, you can create a custom interceptor to track every request sent from your app to a backend server.
import { Injectable } from '@angular/core';
import { HttpEvent, HttpInterceptor, HttpHandler, HttpRequest } from '@angular/common/http';
import { Observable} from 'rxjs/Observable';

import { AppInsightsService } from '@markpieszak/ng-application-insights';

@Injectable()
export class AppInsightsInterceptor implements HttpInterceptor {

  constructor(private appInsightsService: AppInsightsService) {}

  intercept(req: HttpRequest<any>, next: HttpHandler): Observable<HttpEvent<any>> {
    this.appInsightsService.trackEvent(req.url, req.body);
    return next.handle(req);
  }
}
and include it in AppModule’s providers section:
...
providers: [{
 provide: HTTP_INTERCEPTORS,
 useClass: AppInsightsInterceptor,
 multi: true
}]
...
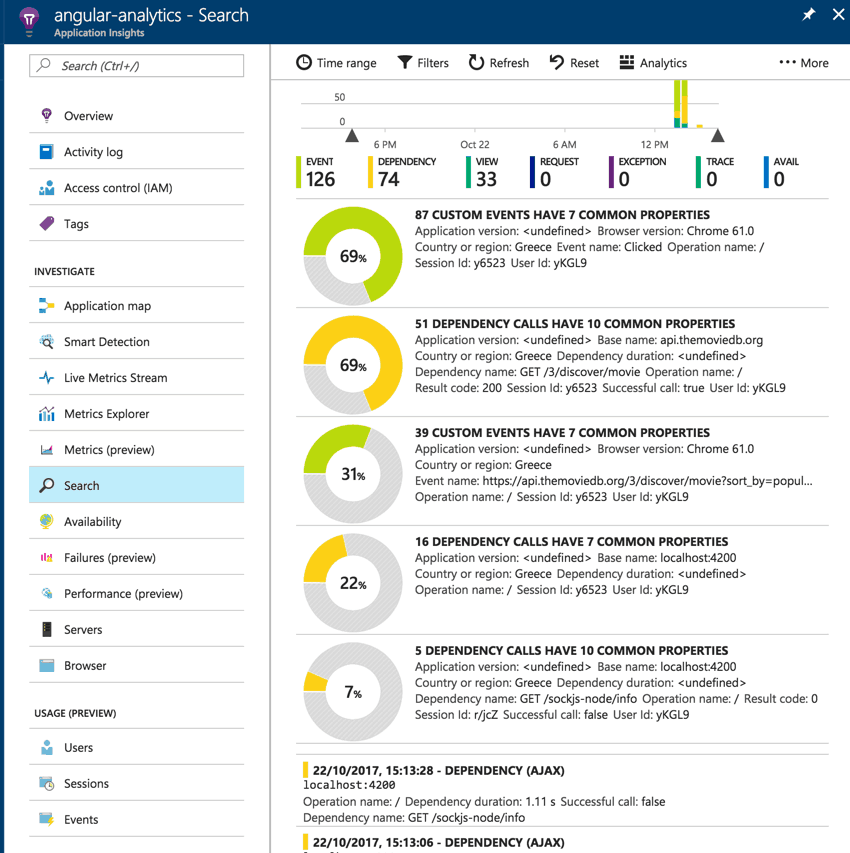
Step 6. Azure App Insights Analytics
After a few minutes of sending events, metrics or performing http calls, which by default are tracked as AJAX dependency calls, you can view how your application performs in Azure App Insights.
If you click on Search in the left sidebar, you can see details about how many calls are performed by your app, their dependencies and a lot of other useful metrics to understand how your app performs.
Great article, helps a lot to understand.
My question is lets say if we implement this Interceptor above which captures all events within that SPA Angular application, apart from including it in the App module in the PROVIERS, do we still have to make a trackEvent() method call in every event we want to track or since its been defined as interceptor it will intercept every request and track it? Also if we are using the trackEvent method, can we also use the TrackPageView() method or that’s not needed since trackEvent will cover it? Any help on this question.
You can use any of the SDK API methods based on your needs. Also, you can have multiple interceptors for different type of events, views, pages etc.
The difference between each API method is on how the data are going to be visualized in Application Insights dashboard. This page will also help you.
Usually, `TrackEvent()` is used to track events like an `AccountIsCreated` or `AccountLoggedIn`, while TrackPageView() is mostly about page views.
If I recall correctly, TrackEvent() does not record the page that the event was fired from unless you provide it.