Since Azure SDK 2.7 for .NET App Service Tools for Visual Studio 2015 supports remote profiling for Web Apps, API Apps and WebJobs running in Azure. So, in case you want to analyze performance issues in your application there are three ways you can do it:
- Using Visual Studio 2015
- Browsing the Azure App Service’s Site Control Management dashboard (aka kudu)
- Using REST APIs
This option is available on all Tiers except Free and Shared. Your app needs to be upgraded to Basic or Standard to be profiled.
How Profiling Works
Performance issues are analyzed through Sampling data, where Sampling is a statistical profiling method that shows you the functions that are doing most of the user mode work in the application. Sampling is a good place to start to look for areas to speed up your application.
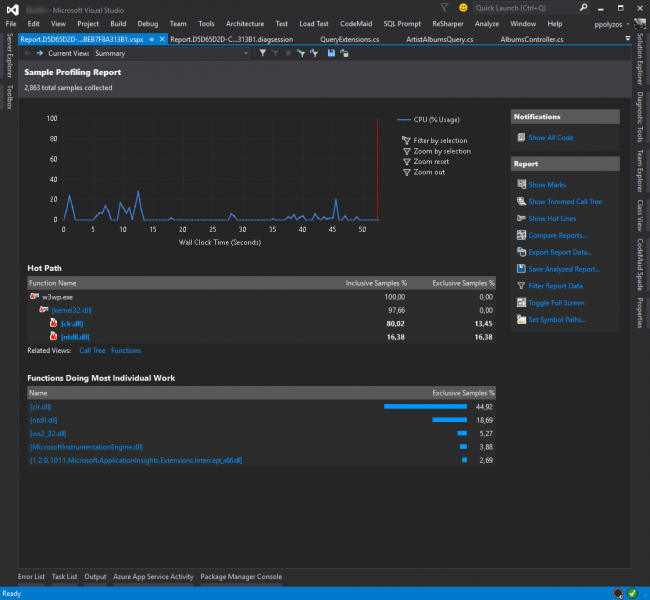
At specified intervals, the Sampling method collects information about the functions that are executing in your application. After you finish a profiling run, the Summary view of the profiling data shows the most active function call tree, called theHot Path, where most of the work in the application was performed. The view also lists the functions that were performing the most individual work, and provides a timeline graph you can use to focus on specific segments of the sampling session
Profiling Using Visual Studio 2015
- Open Server Explorer (View menu > Server Explorer).
- Expand Azure, App Service, your Resource group then right-click the app’s node and select the Start Profiling gesture.
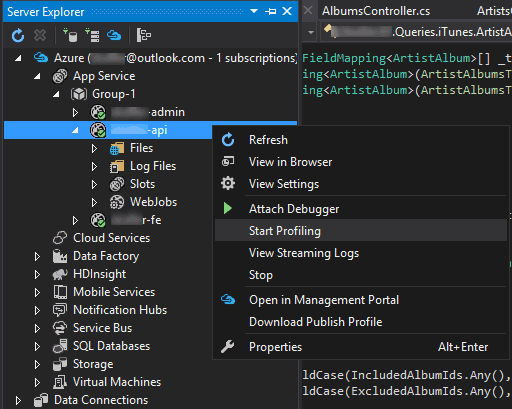
The remote profiling session will start and will collect data till you select the Stop Profiling gesture again right-clicking in the app’s node where profiling is running.
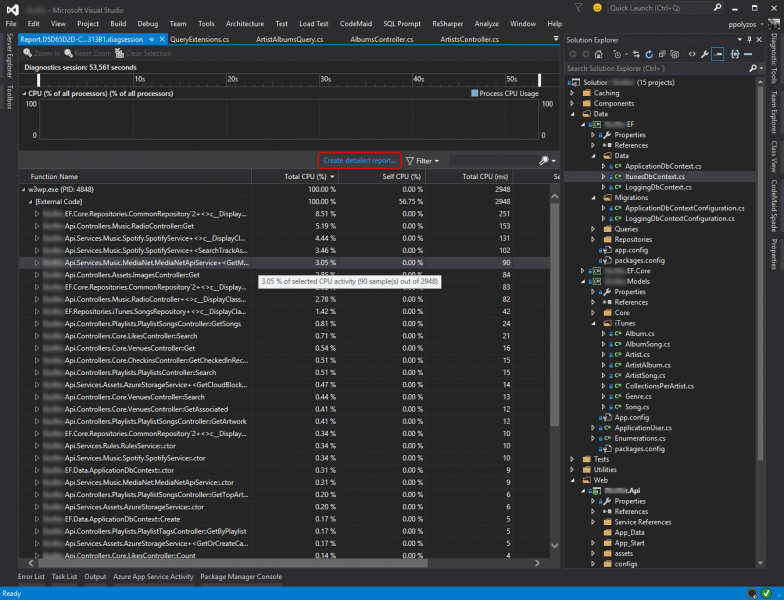
In this report you can view all details related to Total CPU cost of each function and is easy to identity functions with an abnormal behavior.
In addition, in the center of the screen you may find a like “Create detailed report…” that generates a more detailed view and in case the source code is already loaded, it can point to the exact line of source code where the performance degrades.
Profiling using the kudu site
Every site hosted in Azure has a “scm” endpoint (<yoursite>.scm.azurewebsites.net) which provides a set of troubleshooting and analysis tools for use with Microsoft Azure Web Apps. These tools are open sourced and more info can be found here.
In order to start profiling your app using KUDU site please follow the steps below:
- Navigate to your site’s scm endpoint (<yoursite>.scm.azurewebsites.net).
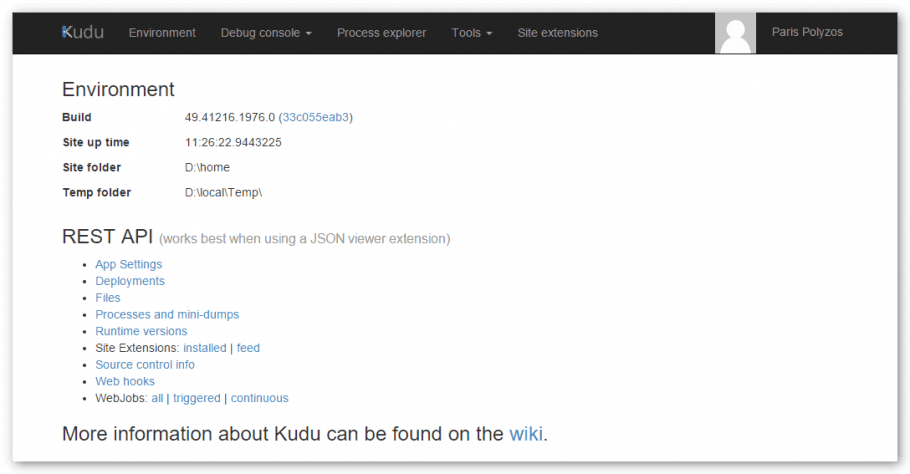
- Click on Process Explorer. Here you will see all the processes running in the site’s context(sandbox).
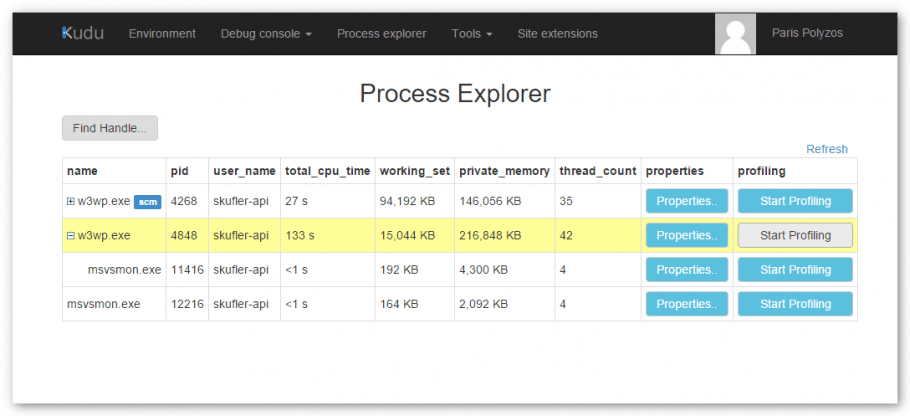
- Click Start Profiling button for the process you wish to profile and after a few minutes when you press the Stop Profiling button a report will be generated
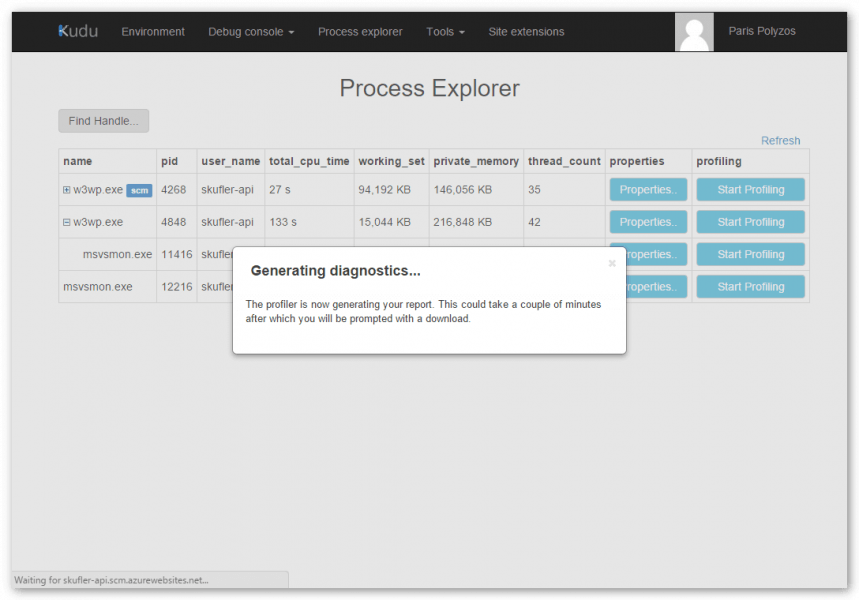
Please note that the profiling session will be terminated if a session is started from the kudu site and is running for more than 15 minutes.
The generated report can be opened in Visual Studio 2015 or using PerfView, a performance-analysis tool that helps isolate CPU- and memory-related performance issues. You can learn on how to use PerfView following this set of tutorials in Channel9,
Profiling using REST calls
Kudu endpoint also a provides a set of REST API calls that allows you to start and stop a profiling session.
Again through your sites “scm” endpoint (<yoursite>.scm.azurewebsites.net) you can:
- Start a profiling session through a POST `/api/processes/{process id}/profile/start` call.
- Stop a profiling session and download the profile through a GET `/api/processes/{process id}/profile/stop` call.